Dimensional World ex U.S. Core Equity 2 ETF
Доходность за полгода: 2.22%
Отрасль: Small Cap Growth Equities
Сравнение ETF
Очистить список| Параметр | Dimensional World ex U.S. Core Equity 2 ETF | iShares Core S&P Mid-Cap ETF | iShares Russell 2000 ETF | Vanguard Small Cap ETF | SPDR S&P Midcap 400 ETF Trust | Vanguard Small Cap Growth ETF |
|---|---|---|---|---|---|---|
| Активы | 6873000000 | 82409000000 | 58733000000 | 53828000000 | 21532000000 | 17064000000 |
| Цена | 25.8 | 58.27 | 201.83 | 217.58 | 532.9 | 249.71 |
| Годовая доходность | 0 | 44.04 | 46.17 | 43.94 | 43.8 | 33.77 |
| 3 летняя доходность | 0 | 41.42 | 36.39 | 43.53 | 40.75 | 57.76 |
| 5 летняя доходность | 90.48 | 96.57 | 100.38 | 88.69 | 132.17 | |
| Комиссия | 0.28 | 0.05 | 0.19 | 0.05 | 0.24 | 0.07 |
| Дивиденды | 2.81 | 2.93 | 1.32 | 1.54 | 1.20 | 0.69 |
| Средний P/E | 11.45 | 12.82 | 10.96 | 13.30 | 13.46 | 22.40 |
| Число бумаг в ETF | 402 | 1978 | 1492 | 401 | 695 | |
| Категория | Small Cap Growth Equities | Small Cap Growth Equities | Small Cap Growth Equities | Small Cap Growth Equities | Small Cap Growth Equities | Small Cap Growth Equities |
График цены
Dimensional World ex U.S. Core Equity 2 ETF
Простой график
Расширенный график
iShares Core S&P Mid-Cap ETF
Простой график
Расширенный график
iShares Russell 2000 ETF
Простой график
Расширенный график
Vanguard Small Cap ETF
Простой график
Расширенный график
SPDR S&P Midcap 400 ETF Trust
Простой график
Расширенный график
Vanguard Small Cap Growth ETF
Простой график
Расширенный график
Топ 15 эмитентов ETF
При добавлении компаний в список сравнения можно сравнивать по разным параметрам
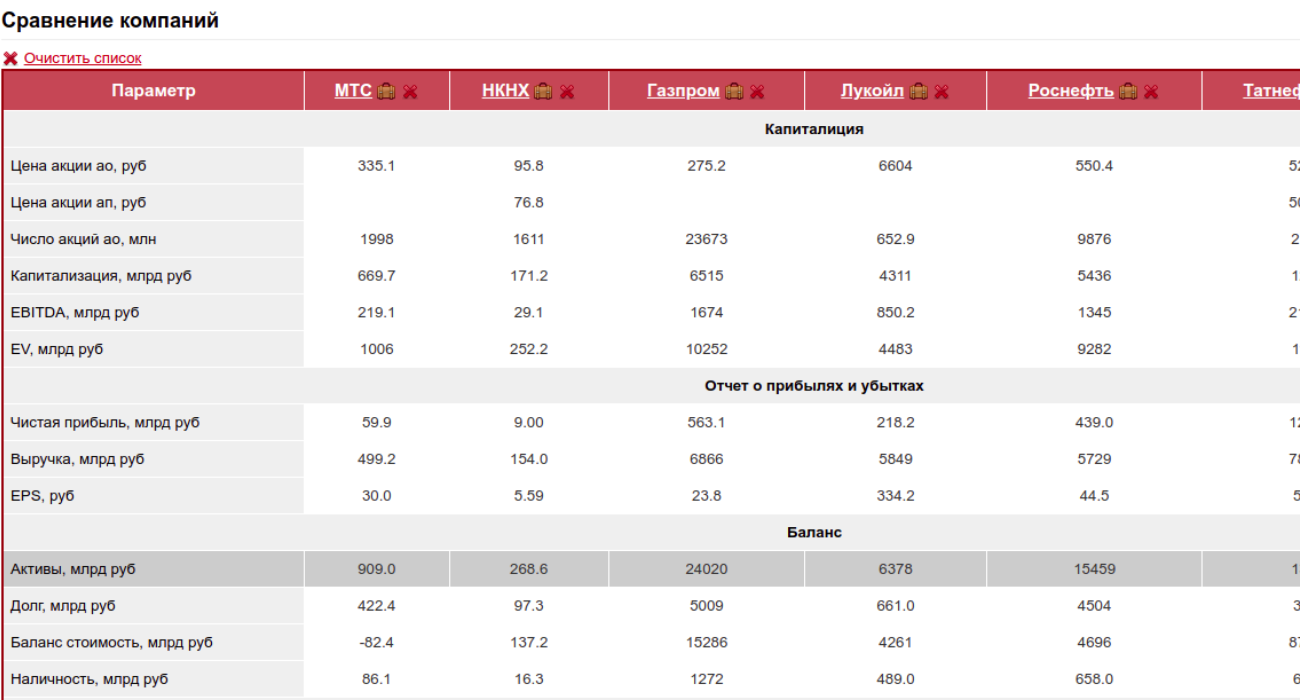
Сравнение компаний
Сравнение компаний по разным важным параметрам.
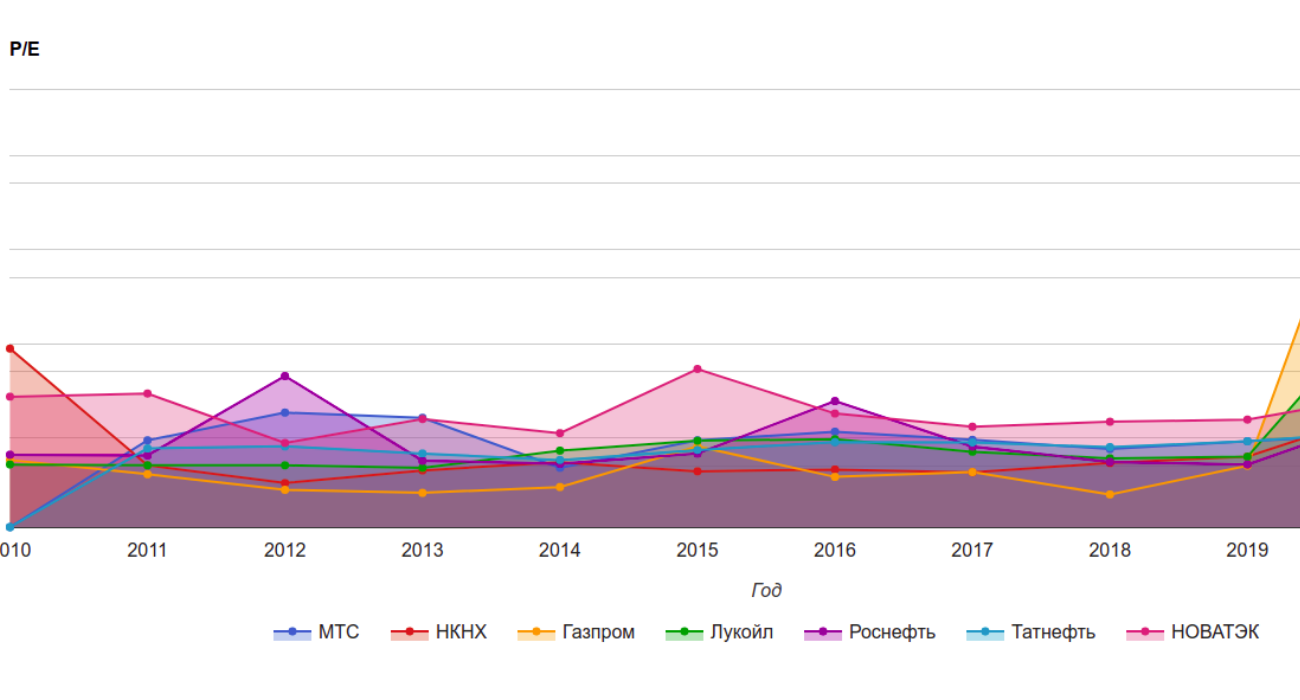
Просмотр исторических данных
У сравниваемых компаний просмотр исторических данных по разным параметрам.
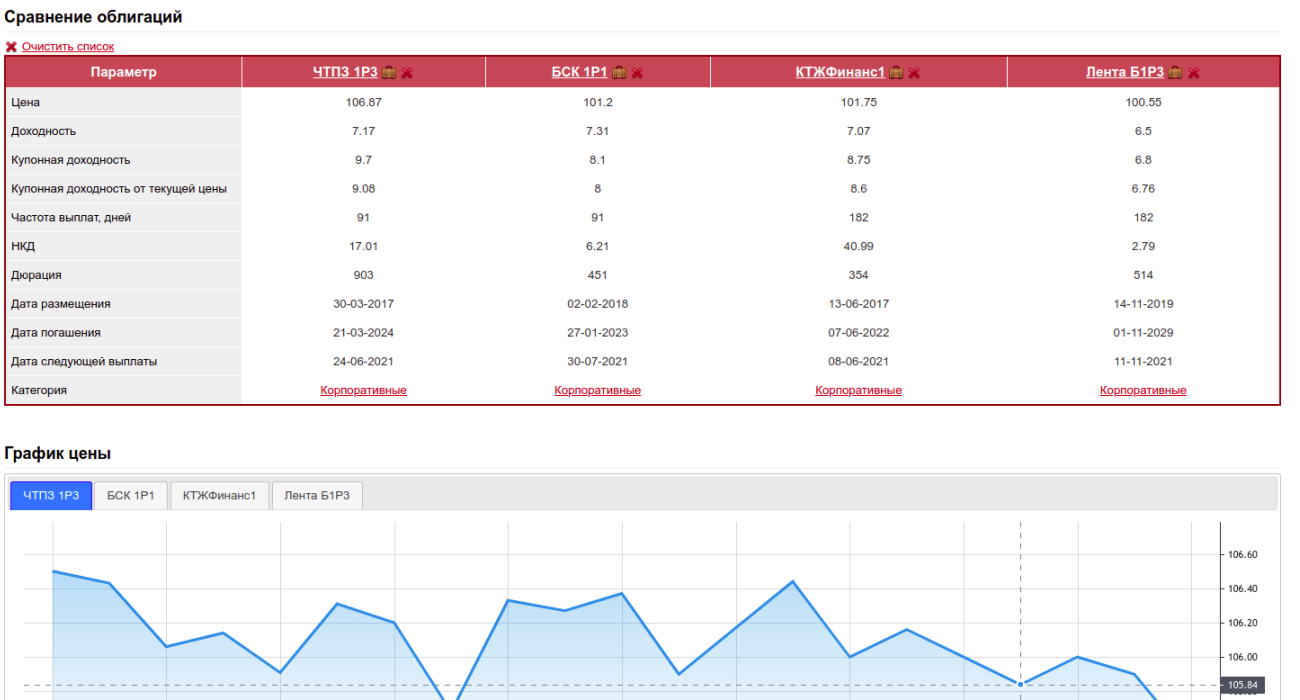
Сравнение облигаций
Промотр и сравнение облигаций, их доходности и купона.
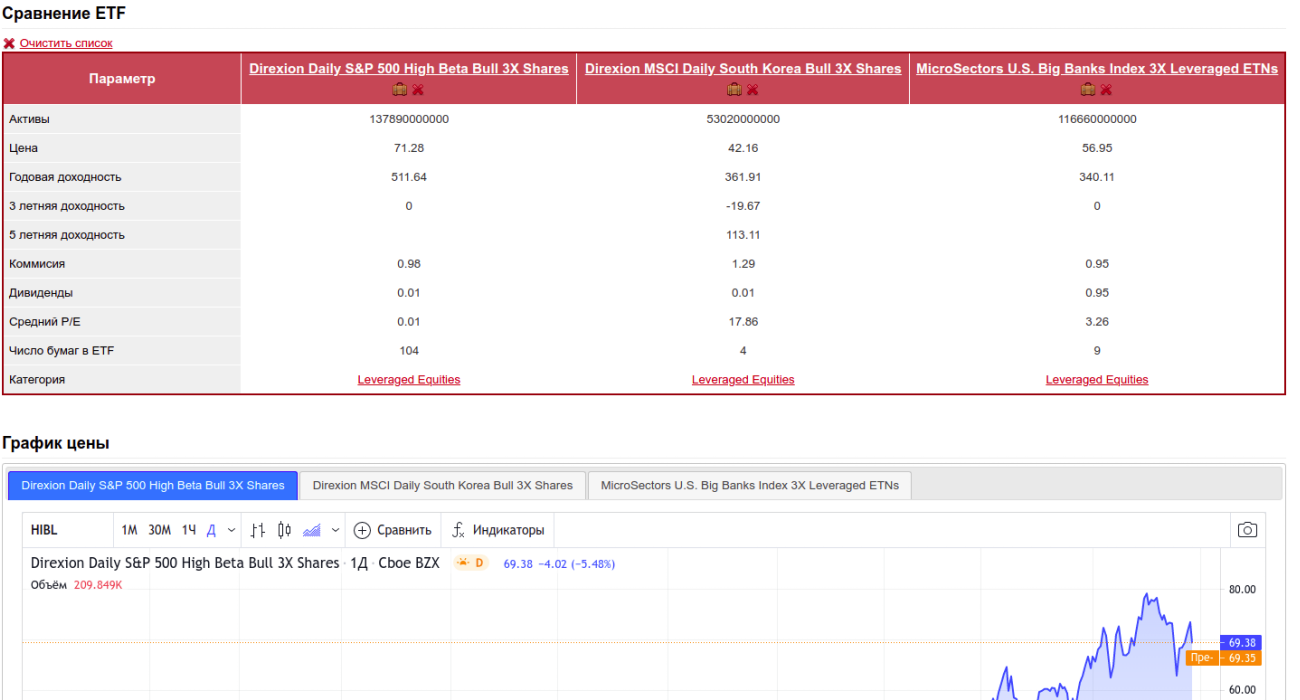
Сравнение ETF
Сравнение ETF, параметров и динамики доходности.