iShares U.S. Medical Devices ETF
Доходность за полгода: 1.85%
Отрасль: Health & Biotech Equities
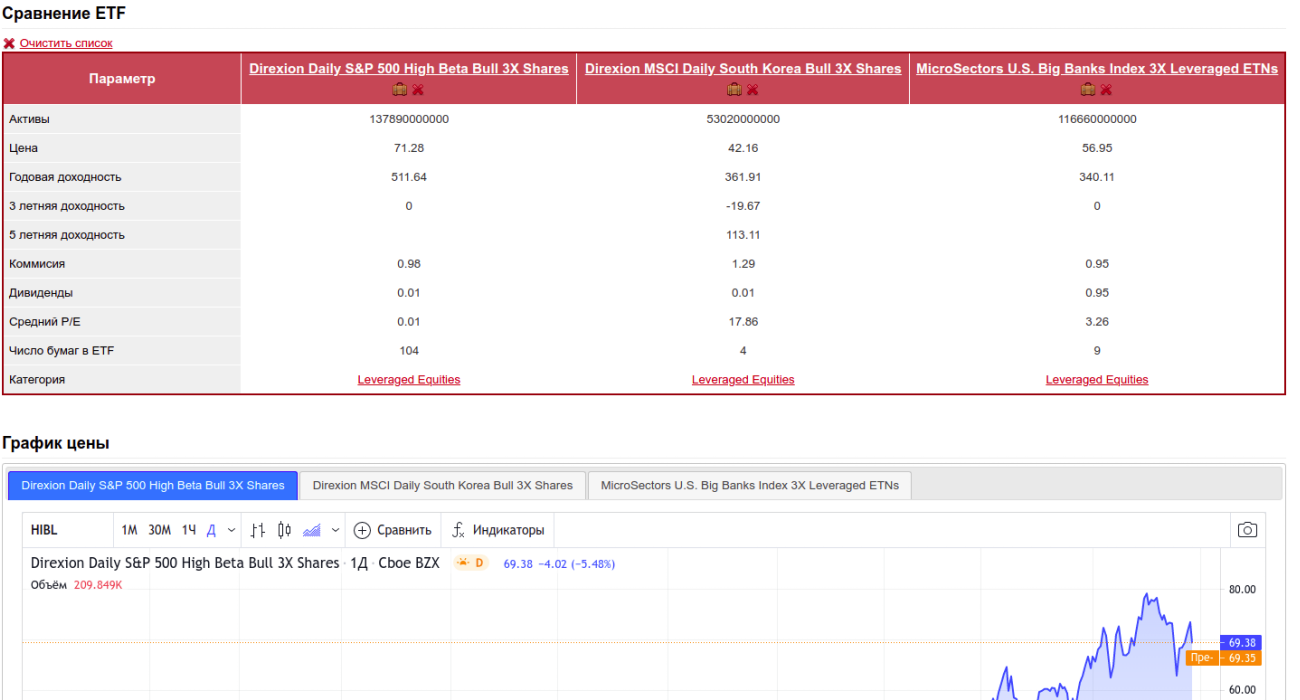
Сравнение ETF
 Очистить список
| Параметр |
iShares U.S. Medical Devices ETF
|
Health Care Select Sector SPDR Fund
|
Vanguard Health Care ETF
|
iShares Biotechnology ETF
|
SPDR S&P Biotech ETF
|
ARK Genomic Revolution ETF
|
|---|---|---|---|---|---|---|
| Активы | 5160000000 | 38903000000 | 17899000000 | 7581000000 | 7241000000 | 1350000000 |
| Цена | 55.03 | 143.3 | 261.88 | 135.09 | 90.87 | 23.16 |
| Годовая доходность | 30.97 | 28.02 | 29.53 | 31.1 | 23.57 | 41.63 |
| 3 летняя доходность | 82.1 | 54.48 | 55.67 | 43.26 | 35.34 | 173.4 |
| 5 летняя доходность | 181.62 | 103.13 | 112.81 | 87.92 | 126.60 | 423.22 |
| Комиссия | 0.40 | 0.09 | 0.10 | 0.45 | 0.35 | 0.75 |
| Дивиденды | 0.53 | 1.54 | 1.29 | 0.29 | 0.14 | |
| Средний P/E | 34.19 | 16.67 | 22.00 | 15.68 | 17.88 | 16.57 |
| Число бумаг в ETF | 67 | 66 | 501 | 271 | 197 | 63 |
| Категория | Health & Biotech Equities | Health & Biotech Equities | Health & Biotech Equities | Health & Biotech Equities | Health & Biotech Equities | Health & Biotech Equities |
График цены
iShares U.S. Medical Devices ETF
Простой графикРасширенный график
Health Care Select Sector SPDR Fund
Простой графикРасширенный график
Vanguard Health Care ETF
Простой графикРасширенный график
iShares Biotechnology ETF
Простой графикРасширенный график
SPDR S&P Biotech ETF
Простой графикРасширенный график
ARK Genomic Revolution ETF
Простой графикРасширенный график
Топ 15 эмитентов ETF
Авторизуйтесь или войдите с помощью:
При добавлении компаний в список сравнения можно сравнивать по разным параметрам
Авторизуйтесь или войдите с помощью:
 Telegram

