John Hancock Multifactor Industrials ETF
Доходность за полгода: 0%
Отрасль: Industrials Equities
Сравнение ETF
Очистить список| Параметр | John Hancock Multifactor Industrials ETF | Industrial Select Sector SPDR Fund | Vanguard Industrials ETF | iShares U.S. Aerospace & Defense ETF | U.S. Global Jets ETF | SPDR S&P Aerospace & Defense ETF |
|---|---|---|---|---|---|---|
| Активы | 10000000000 | 19754280000.00 | 5652545024.00 | 6159225656.00 | 1088476615.00 | 2360269440.00 |
| Цена | 45.29 | 2539.5 | 4967.6899 | 149.21 | 20.11 | 155.61 |
| Годовая доходность | 37.75 | 42.65 | 34.37 | 41.99 | 17.12 | 40.62 |
| 3 летняя доходность | 51.57 | 8.49 | 12.51 | 13.31 | -5.89 | 9.65 |
| 5 летняя доходность | 112.92 | 13.22 | 15.74 | 6.85 | -7.00 | 8.25 |
| Комиссия | 0.40 | 0.09 | 0.10 | 0.40 | 0.60 | 0.35 |
| Дивиденды | 0.86 | 1.51386 | 1.80 | 1.01427 | 1.03392 | 0.73784 |
| Средний P/E | 22.57 | 22.5225 | 17.77 | 26.90615 | 9.96427 | 27.00036 |
| Число бумаг в ETF | 148 | 10 | 10 | 38 | 51 | 31 |
| Категория | Industrials Equities | Industrials Equities | Industrials Equities | Industrials Equities | Industrials Equities | Industrials Equities |
График цены
John Hancock Multifactor Industrials ETF
Industrial Select Sector SPDR Fund
Простой график
Расширенный график
Vanguard Industrials ETF
Простой график
Расширенный график
iShares U.S. Aerospace & Defense ETF
Простой график
Расширенный график
U.S. Global Jets ETF
Простой график
Расширенный график
SPDR S&P Aerospace & Defense ETF
Простой график
Расширенный график
Топ 15 эмитентов ETF
При добавлении компаний в список сравнения можно сравнивать по разным параметрам
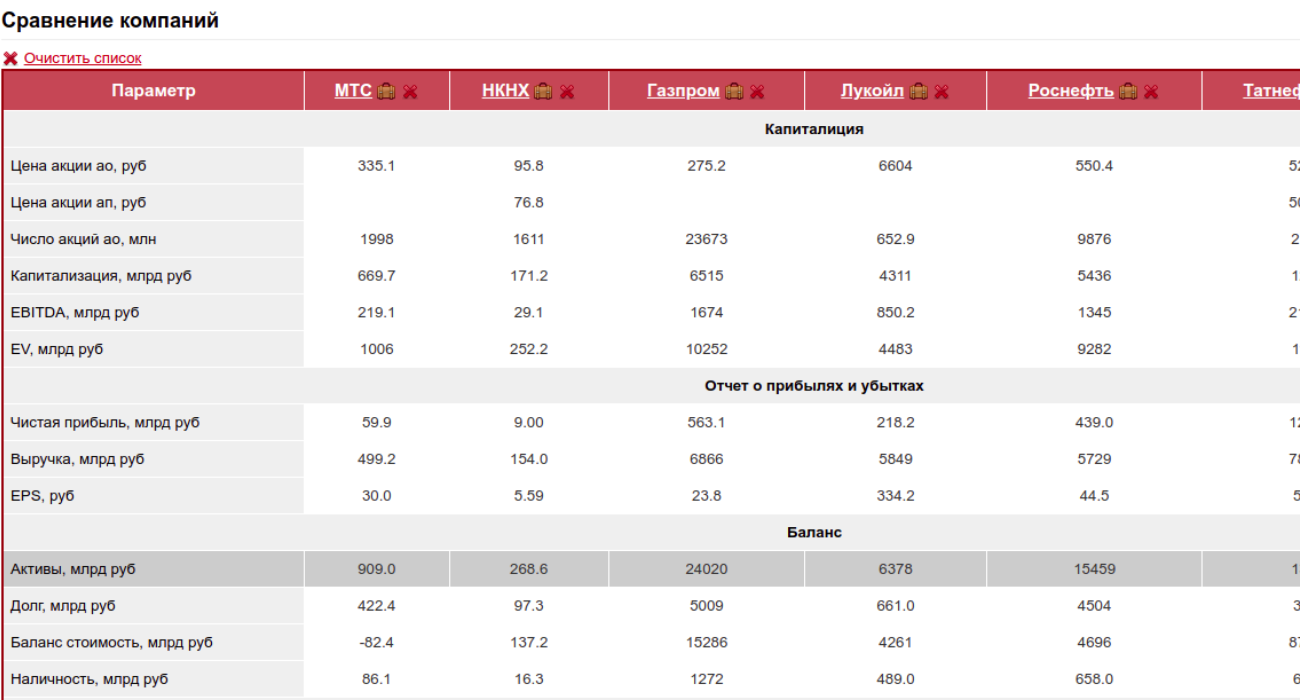
Сравнение компаний
Сравнение компаний по разным важным параметрам.
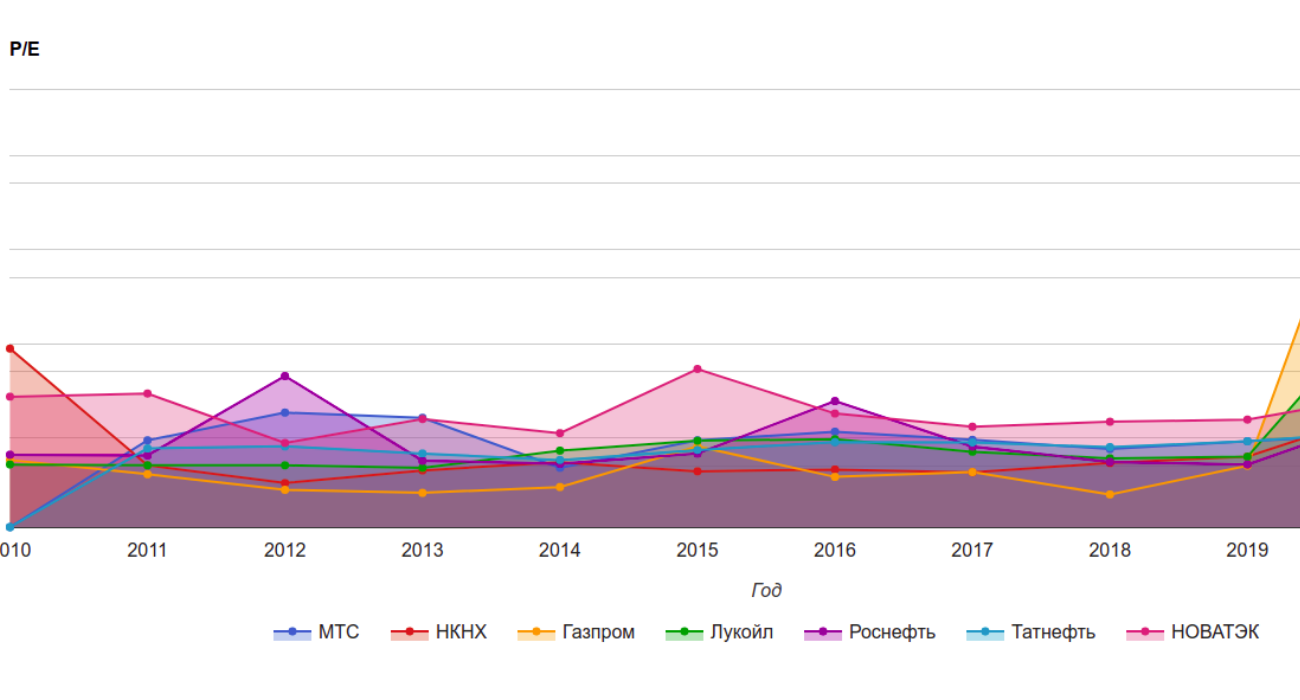
Просмотр исторических данных
У сравниваемых компаний просмотр исторических данных по разным параметрам.
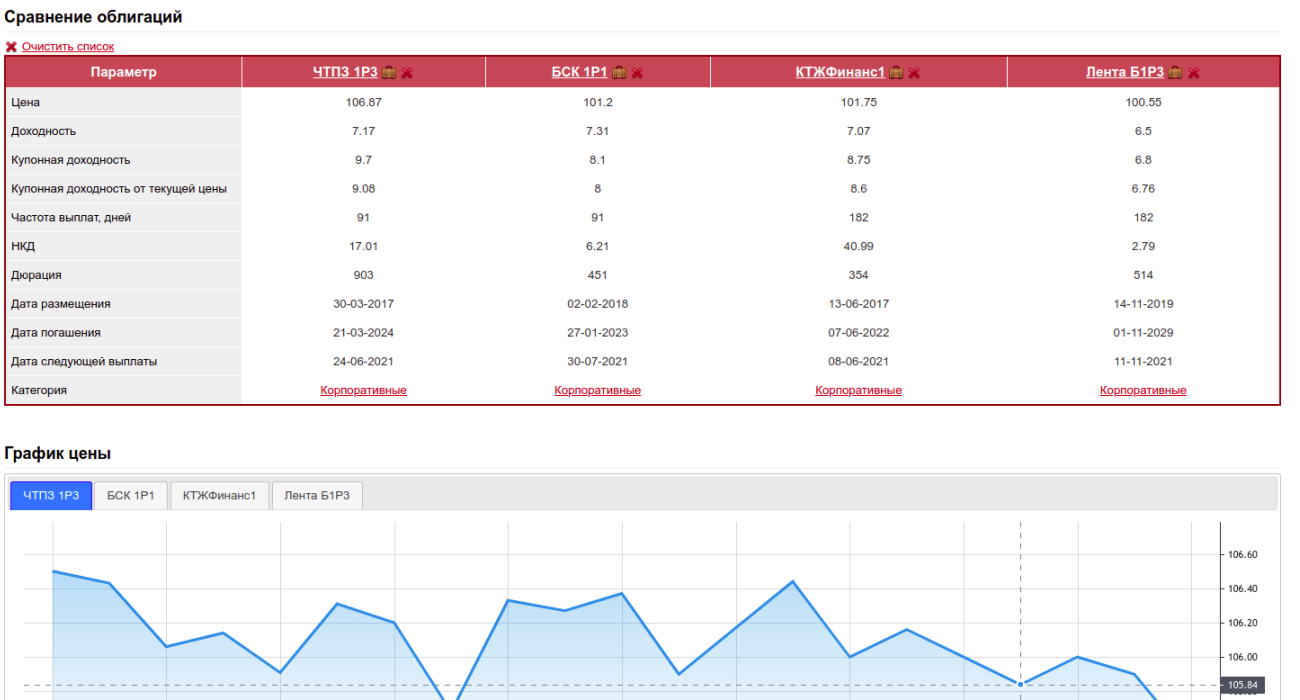
Сравнение облигаций
Промотр и сравнение облигаций, их доходности и купона.
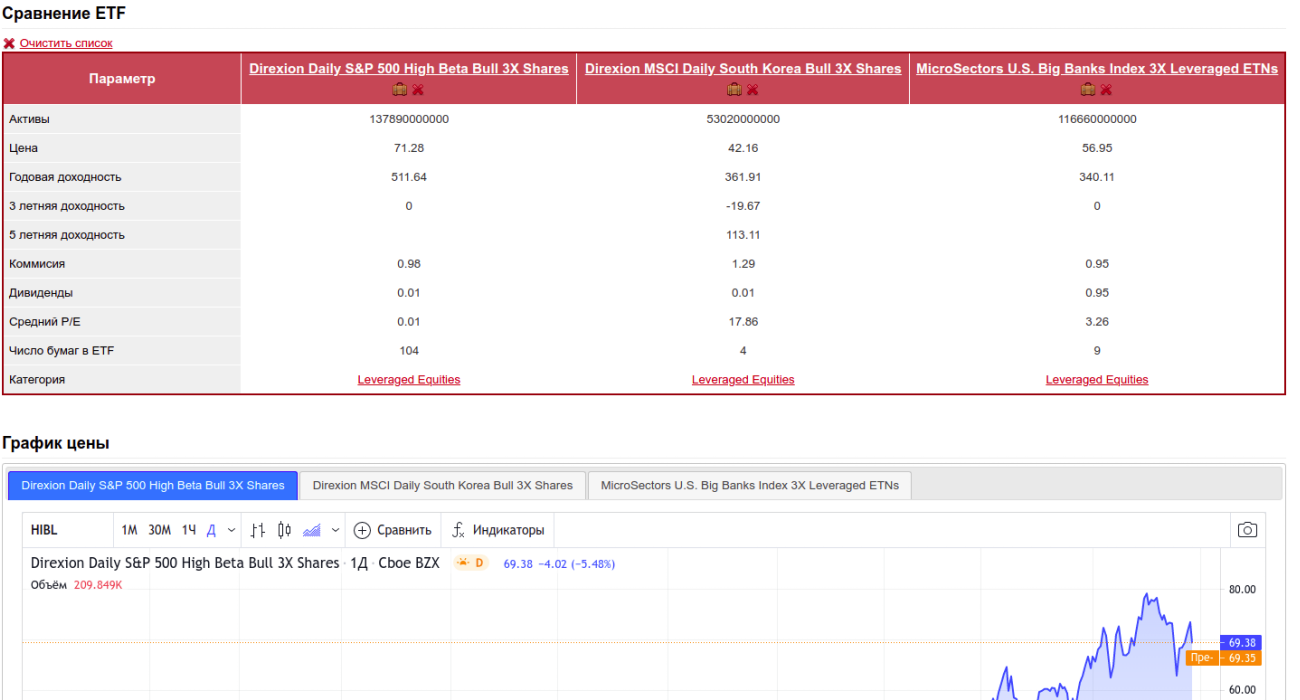
Сравнение ETF
Сравнение ETF, параметров и динамики доходности.